
























Lesson 41 · Data Analysis and Projects
Chapter 8 review: data analysis
A recap of fitting, uncertainty estimation and Fourier analysis in one picture and one table, plus a ten-question quiz mixing the whole chapter.
Simulations and experiments both end with numbers, and this chapter taught you how to turn them into defensible results. You fit models by least squares, sized the uncertainties three different ways, and moved between time and frequency with the FFT. This page puts everything on one sheet.
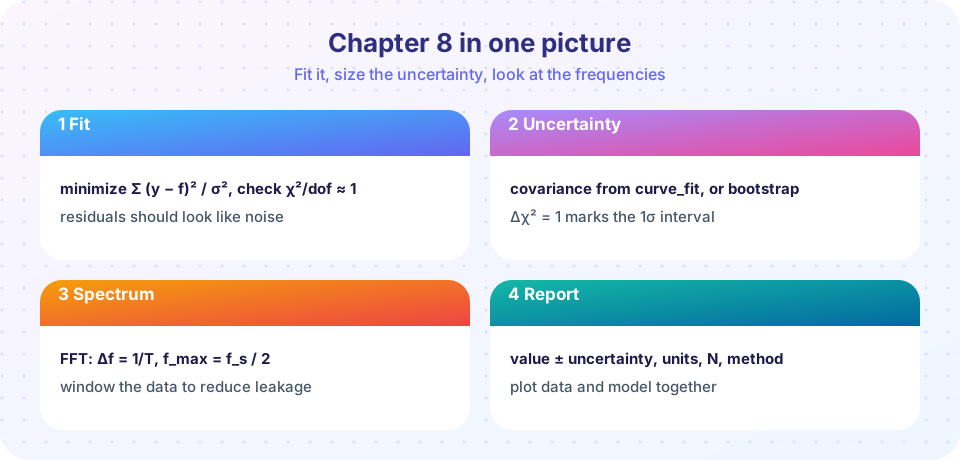
Recap table
| Topic | Key formula or rule | Check |
|---|---|---|
| Statistical error | σ_mean = σ/√N |
100 times more data gives 10 times smaller error |
| Systematic error | bias that does not average away | vary the time step, box size, calibration |
| Chi-square | χ² = Σ((y − f)/σ)², dof = N − p |
χ²/dof ≈ 1, residuals structureless |
| Line fit | σ_m² = S/Δ, σ_b² = S_xx/Δ |
agrees with np.polyfit |
| 1σ interval | where χ² rises by 1 |
matches covariance and bootstrap |
| Resolution | Δf = 1/T |
longer record, finer lines |
| Nyquist | f_max = f_s/2 |
above it, frequencies alias |
| Leakage | non-integer cycles smear the peak | use a Hann window |
Check your understanding
Quick check · 10 questions
of 10 answered You scored / 10 · perfect!
-
1. A mean of 400 measurements has statistical uncertainty 0.05. How large is it for 1600 measurements?
Four times more data halves the uncertainty: 0.05/2 = 0.025. -
2. You fit 15 points with a 3-parameter model and get χ² = 30. What is χ²/dof, and what does it suggest?
dof = 12 and 30/12 = 2.5, well above 1. -
3. Which method gives parameter uncertainty by refitting resampled data?
The bootstrap resamples with replacement and uses the spread of refit results. -
4. A record lasts 5 s. What is the smallest frequency separation you can resolve?
Δf = 1/T = 0.2 Hz. -
5. A 130 Hz tone sampled at 200 Hz appears at...
Nyquist is 100 Hz; 130 Hz folds to 200 − 130 = 70 Hz. -
6. Which is a systematic error in a simulation?
Too large a step biases every result in the same way, and a longer run does not remove it. -
7. Why divide the Hann-windowed spectrum by the window sum?
The window reduces the signal amplitude; dividing by its mean (sum/N) compensates. -
8. Residuals of a fit show a clear upward trend. The best action is to...
A trend means the model misses a systematic effect. -
9. Which statement about zero padding before an FFT is correct?
Resolution is set by the record length only. -
10. A 'result' is reported as '12.3'. What is missing?
A number is not a result without its unit and uncertainty.
Summary
- Statistical errors fall like
1/√N; systematic errors need different checks, not more data. - Judge fits by
χ²/dofand residuals; get uncertainties from covariance,Δχ² = 1or the bootstrap. - The FFT resolves
Δf = 1/Tup tof_s/2; avoid aliasing and leakage. - Report value, uncertainty, unit and method.
Track your progress
Create a free account to tick off lessons and pick up where you left off on any device.
of Computational Physics lessons completed